
Fig. 4.
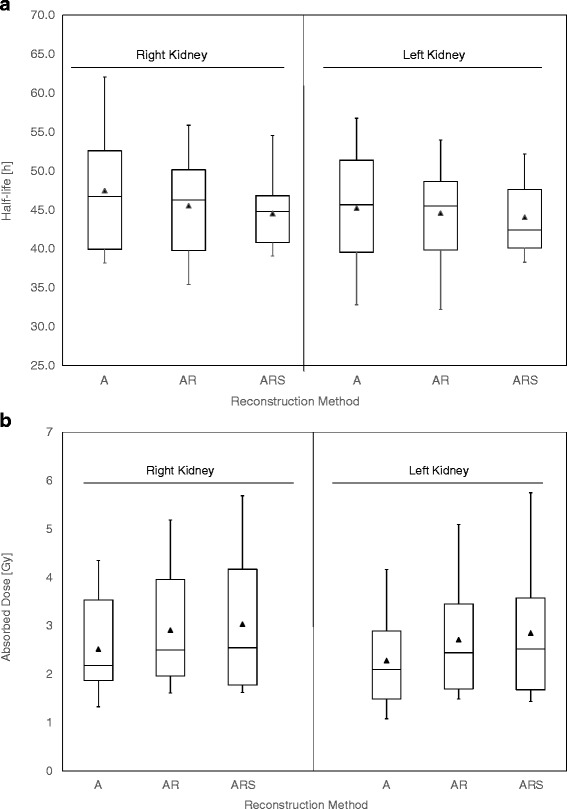
Box plots of effective half-live (above) and absorbed dose estimates (below) to the right and left kidneys for ten different patient cases. The full triangles indicate average values of the set and the whiskers are extended to minimum and maximum data values (Spear style)