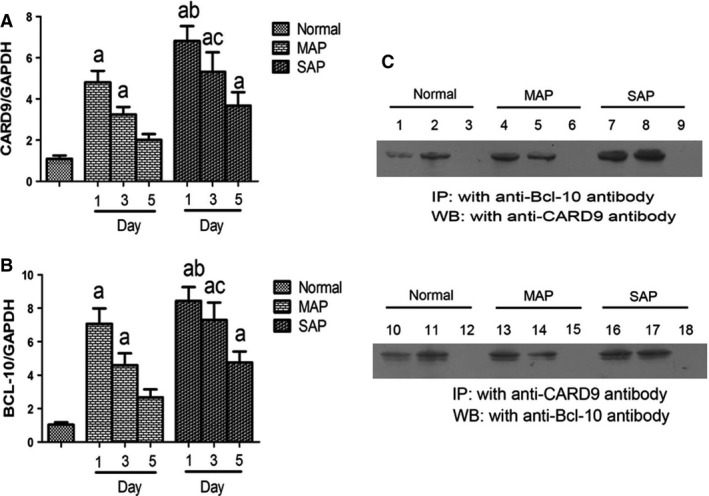
Figure 2.

Immunoprecipitation analysis and mRNA levels in PBMCs. (A) Card9mRNA expression; (B) Bcl10 mRNA expression; (C) immunoprecipitation of Card9‐Bcl10 complex (input: 1, 4, 7, 10, 13, 16; anti‐Bcl‐10 immunoprecipitated complex: 2, 5, 8; anti‐Card9 immunoprecipitated complex: 11, 14, 17; lank control: 3, 6, 9, 12, 15, 18). Immunoprecipitation analysis was representative from 20 healthy volunteers, 35 MAP and 17 SAP patients. PCR results were means ± S.D. of measurement on day 1, 3 and 5 (ncontrolled group = 20, nMAP patients = 17, nSAP patients = 35). a: control versus SAP. MAP, P < 0.05; b: SAP on day 1 versus MAP on day 1, P < 0.05; c: SAP on day 3 versus MAP on day 3, P < 0.05.
