
Figure 5.
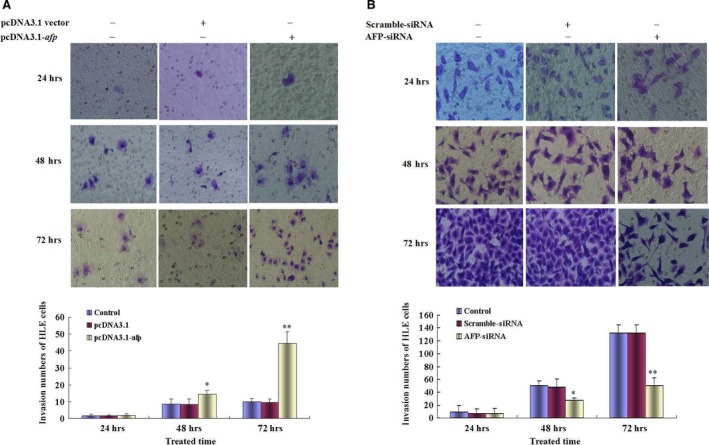
Effects of AFP on invasion of human liver cancer cells HLE and Bel 7402. (A) HLE cells were transfected with pcDNA3.1‐afp vectors for 24, 48, 72 hrs, respectively; invasive cells were stained with 0.1% crystal violet and observed by microscopy; low columnar graph indicated the quantity of invasive cells; *P < 0.05, **P < 0.01 versus control and pcDNA3.1‐vector groups. (B) Bel 7402 cells were transfected with AFP‐siRNA vectors for 24, 48, 72 hrs, respectively; invasive cells were stained with 0.1% crystal violet and observed by microscopy; low columnar graph indicated the quantity of invasive cells; *P < 0.05, **P < 0.01 versus control and scramble‐siRNA groups. Three independent experiments were performed for these data.