Figure 5.

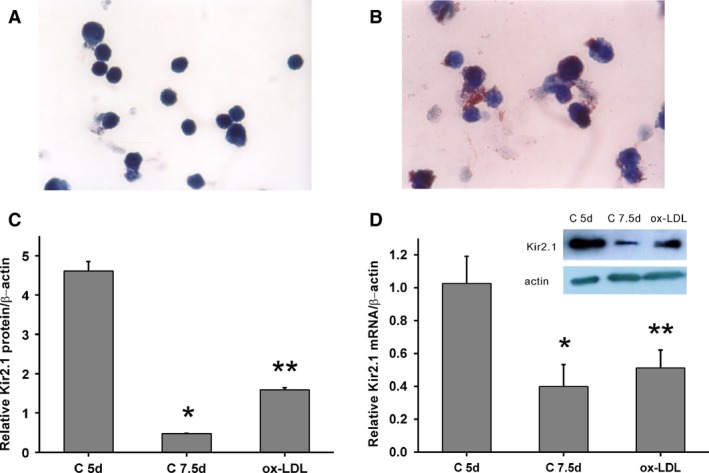
Kir2.1 expression in human monocyte‐derived macrophages. Cultured human monocyte‐derived macrophages (A) and foam cells (B) stained with Oil red O (×100). (C) KCNJ2 mRNA expression. *, **P < 0.05 versus the C 5d group; **P > 0.05 versus the C 7.5d group. (D) Typical protein expression gels (top) and histogram (bottom) showing the expression of Kir2.1 protein. *, **P < 0.001 versus the C 5d group; **P = 0.001 versus the C 7.5d group. Values are the mean ± SE.
