Figure 6.

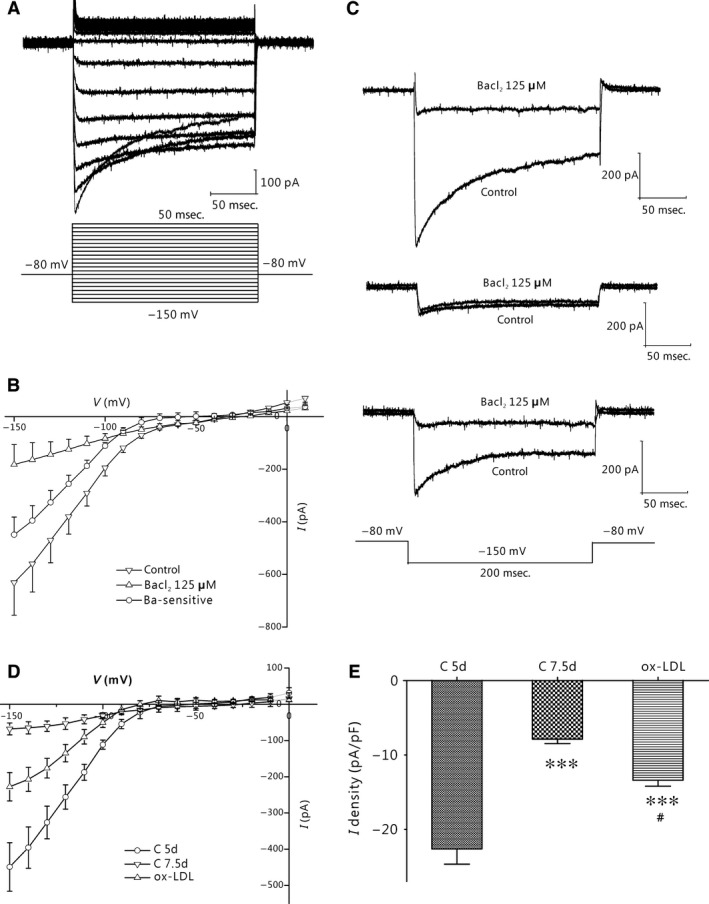
Development change Kir2.1 currents in human monocyte‐derived macrophages. (A) Typical traces of Kir2.1 currents recorded from macrophages in the C 5d group. Membrane potential was held at −80 mV and pulse potentials were applied from −150 mV to +50 mV, stepped 10 mV as indicated. (B) I‐V curves showing that Kir2.1 currents in C 5d group macrophages were inhibited by BaCl2. The BaCl2‐sensitive current was calculated by subtracting the current in the presence of 125 μmol/l BaCl2 from the control current (n = 5 per group). (C) Representative traces of Kir2.1 currents pre‐ and post‐BaCl2 application from macrophages in the C 5d (top), C 7.5d (middle) and ox‐LDL groups (bottom). (D) Relative I‐V curves of BaCl2‐sensitive current in the C 5d, C 7.5d and ox‐LDL groups (n = 5 per group). (E) Comparison of the current amplitude at −150 mV of Kir2.1 currents in the C 5d (n = 47), C 7.5d (n = 28) and ox‐LDL (n = 18) groups. ***P < 0.001 versus the C 5d group; #P < 0.05 versus the C 7.5d group. Values are the mean ± SE.
