Table 1. Exploration of SAR around compound 5. Fluorescent-based thermal shift (ΔT m) values against the EthR target (at 100 μM concentration of compound), IC50 values measured by SPR and binding affinities (K D) determined by ITC are given where available (n. d. = no heats of binding detected).
| Compound number | Compound structure | ΔT m/°C | IC50/ μM (SPR) | K D/ μM (ITC) |
| 1 |
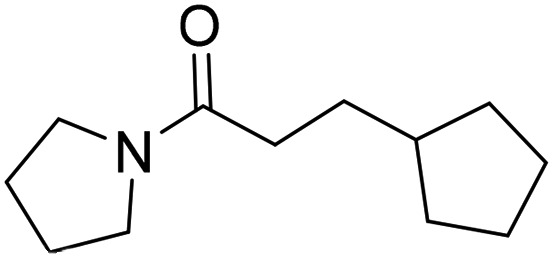
|
+3.5 | 280 | 12 |
| 2 |

|
+3.8 | >100 | n.d. |
| 5 |

|
+4.3 | 35 | 5 |
| 14 |

|
+6.3 | 7 | 3 |
| 15 |
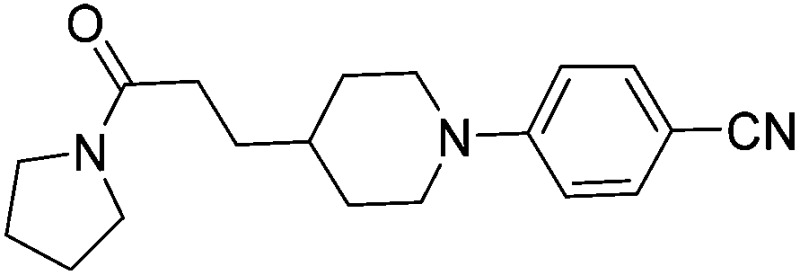
|
+7.5 | 3 | 1 |
| 16 |

|
+9.3 | 3 | n.d. |
| 17 |
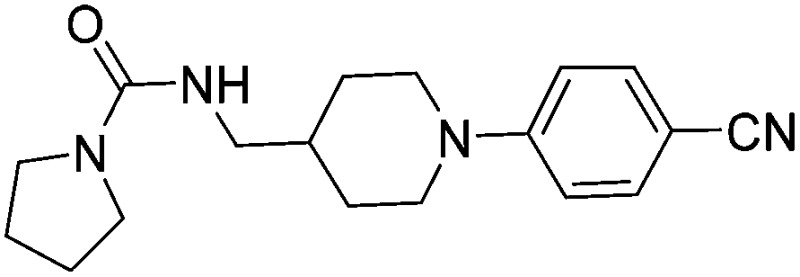
|
+7.2 | 4 | n.d. |
| 18 |

|
+8.8 | 2 | n.d. |
| 19 |
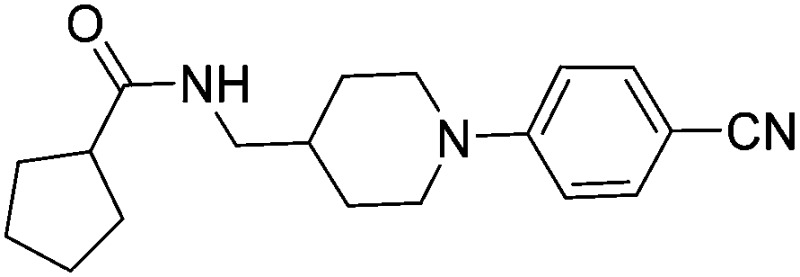
|
+5.9 | 25 | n.d. |
| 20 |

|
+5.5 | >100 | n.d. |
| 21 |
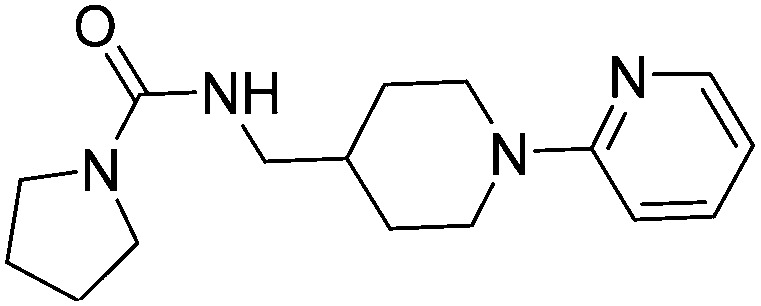
|
+3.8 | 22 | 24 |
| 22 |
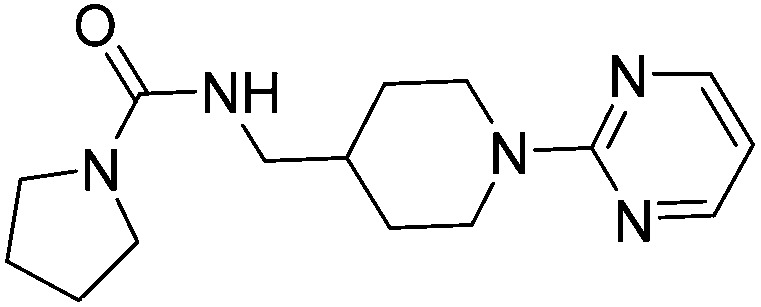
|
+3.7 | 20 | 12 |
