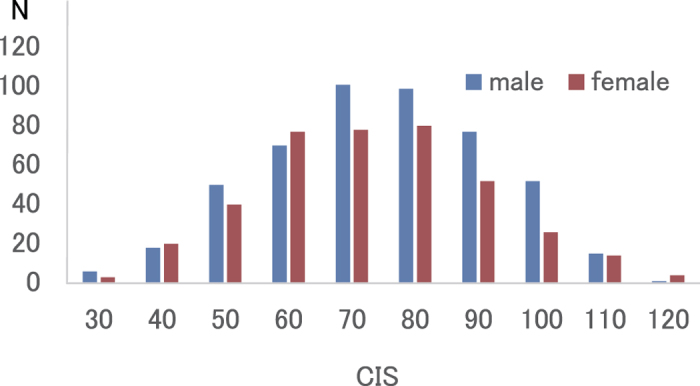
Figure 1. Distribution of CIS scores for men and women (n = 883).

Histograms show the distributions of CIS scores for men and women. Abbreviations: CIS, Checklist Individual Strength Questionnaire.

Histograms show the distributions of CIS scores for men and women. Abbreviations: CIS, Checklist Individual Strength Questionnaire.