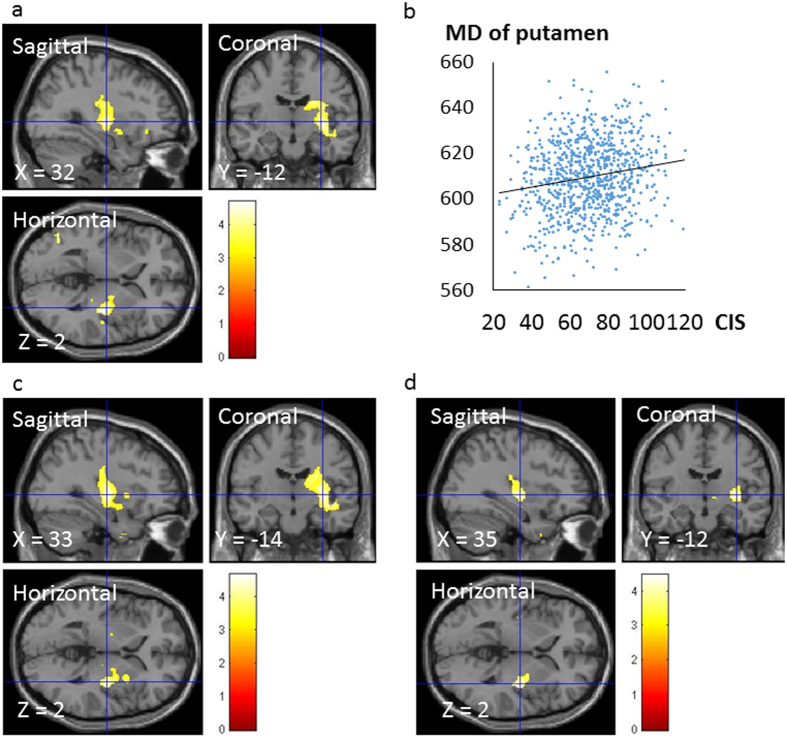
Figure 2. Regions showing a correlation between MD and scores on CIS, motivation and physical activity subscores.
The red-to-yellow colour scale indicates the t-score for the positive correlation between MD and CIS scores (p < 0.001, uncorrected). Regions showing correlations were overlaid on a single T1 image in the SPM5 toolbox. Areas of significant correlations are shown in the right putamen (a). Scatter plots illustrating the relationship between mean MD and CIS scores (b). A cluster with significant correlations was seen in the right putamen and spanned from the palladium to the caudate. We set the statistical significance of analyses at p < 0.05, which was corrected for multiple comparisons at the adjusted cluster level with an underlying voxel level of p < 0.001, uncorrected. The areas of the significant correlations are shown in the right putamen when the red-to-yellow colour scale indicates the t-score for the positive correlation between MD and the motivation subscore (p < 0.001, uncorrected) (c). The areas of significant correlations are shown in the right putamen when the red-to-yellow colour scale indicates the t-score for the positive correlation between MD and physical activity subscore (p < 0.001, uncorrected) (d). Abbreviations: CIS, Checklist Individual Strength Questionnaire; MD, mean diffusivity.

