
Figure 2. A graphical representation of the variability in non-core ORFs in the thirty eight 936 group phages.
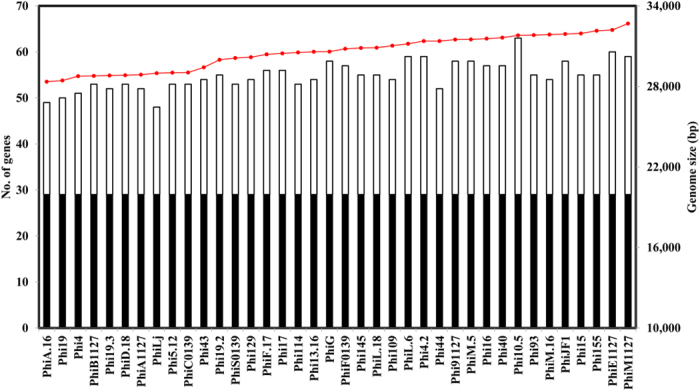
Black bars represent the core genome, white bars represent the non-core genes and the red line indicates genome size (bp).
Official websites use .gov
A
.gov website belongs to an official
government organization in the United States.
Secure .gov websites use HTTPS
A lock (
) or https:// means you've safely
connected to the .gov website. Share sensitive
information only on official, secure websites.
Black bars represent the core genome, white bars represent the non-core genes and the red line indicates genome size (bp).