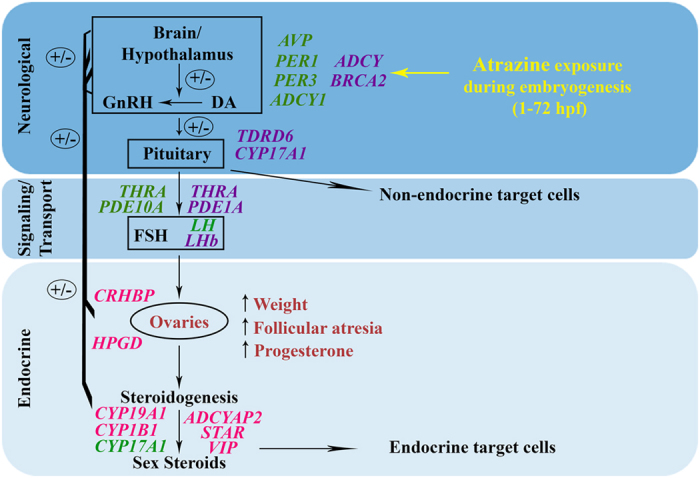
Figure 4. Schematic diagram of the effects of an embryonic atrazine exposure on the HPG axis in female zebrafish.

Diagram representing the effects of an embryonic atrazine exposure at 72 hpf as well as in brain and ovarian tissue of adult females exposed during embryogenesis compiling the data from this study, Weber et al.32, and Wirbisky et al.33. The genes in green are representative of changes observed at 72 hpf; genes in purple are altered in adult female brain tissue; genes listed in pink are those altered in adult female gonad tissue; and red signifies the morphological alterations observed.
