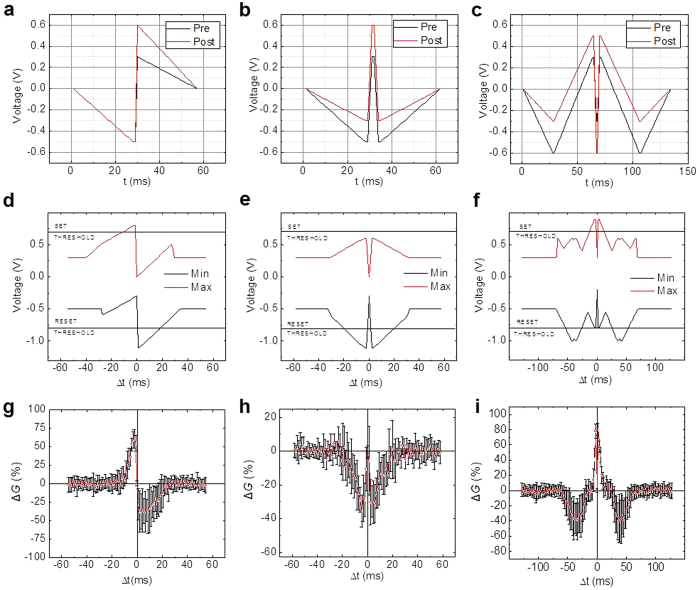
Figure 2. Experimental results for spike-time-dependent plasticity.
Implemented STDP windows similar to those typical for biological synapses: in Layer 5 (the left column) and Layer 4 (the middle column) of the neocortex, and in GABAergic synapses (the right column). (a–c) The used shapes of pre-synaptic (“pre”, black lines) and post-synaptic (“post”, red lines) voltage pulses. (d–f) The time maxima and minima of the net voltage applied to the memristor, as functions of the time interval Δt between the pre- and post-synaptic pulses. (g–i) The experimentally measured STDP windows, i.e. the changes of memristor’s conductance as functions of Δt. The red points and black error bars show, respectively, the averages and the standard deviations of the results over 10 experiments for each value of Δt. In these experiments, the initial memristor conductance G0 was always close to 33 μS.

