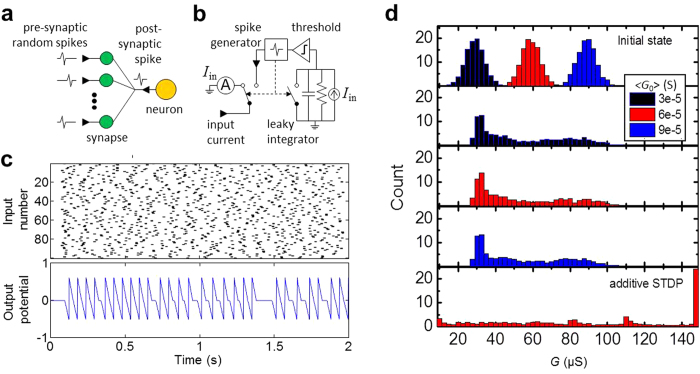
Figure 4. Self-adaptation of spike-time-dependent plasticity.
Simulation of memristor self-tuning in a simple spiking network, using Eqs. (1 for STDP description. (a) The simulated network; (b) its equivalent circuit; (c) typical input and output spiking activity; and (d) the initial and final distributions of conductances, averaged over 10 runs, for several values of the initial conductance G0. On panel (c), the top graph uses grey color coding to shows the spike initiation times. On panel (d), three middle figures show the final distribution of conductances for three values of G0, after 60 s of simulated time. The bottom figure of panel (d) shows the final weight distribution for the hypothetical “additive” STDP model, obtained by artificially setting λG = 1. The neuron parameters are as follows: R = 4 kΩ, C = 1 μF, activation threshold Ut = 0.5 V.

