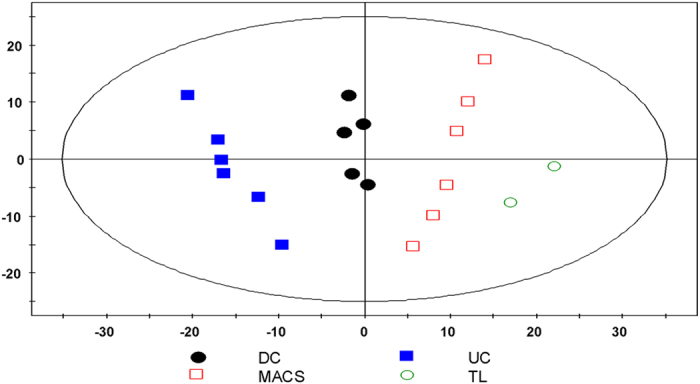
Figure 3. Principal Component Analysis (PCA) score plot.

Each spot represents one mitochondrial sample isolated from HepG2 cells using three different methods: DC, differential centrifugation; UC, ultracentrifugation; MACS, magnetic bead-assisted isolation. TL, total cell lysate. All lipid variables with relative standard deviation less than 20% in the quality control samples were used for PCA modeling. Values were pretreated by unit variance (uv) scaling. Shown are the first two principal components (PC1 = 0.41, PC2 = 0.21); R2X = 0.865, Q2 = 0.748.
