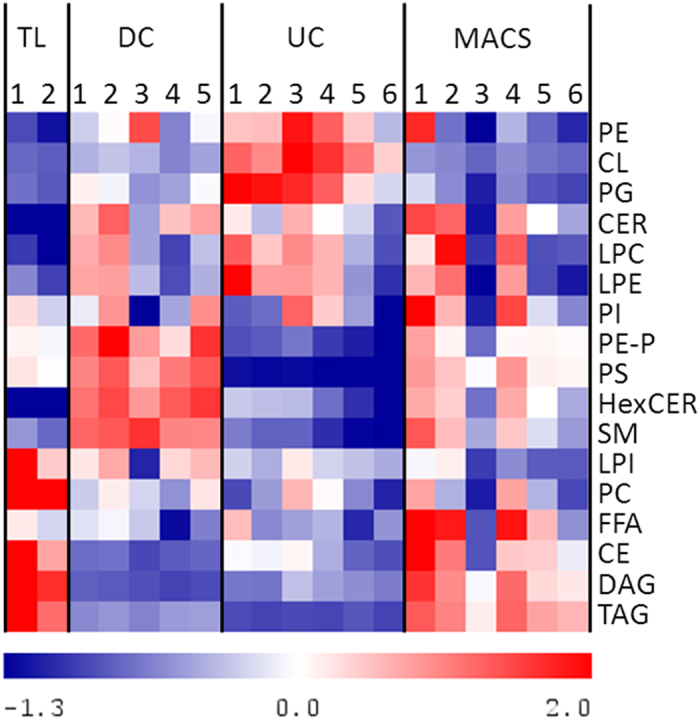
Figure 4. Heatmap visualization of the different lipid (sub-) classes in total cell lysates (TL) and in mitochondrial samples isolated by three different methods: Differential centrifugation (DC), ultracentrifugation (UC), and magnetic bead-assisted isolation (MACS).

Each column represents an individual mitochondrial isolation. Values were centred to the mean of the respective lipid class and scaled to unit variance. White colour shows values close to the mean of the lipid class and red- and blue- coloured values are higher and lower, respectively, than the mean. CE, cholesteryl ester; CER, ceramide; CL, cardiolipin; DAG, diacylglycerol; FFA, free fatty acids; HexCER, hexosyl-ceramide; LPC, lyso-phosphatidylcholine; LPE, lyso-phosphatidylethanolamine; LPI, lyso-phosphatidylinositol; PC, phosphatidylcholine; PE, phosphatidylethanolamine; PE-P, phosphatidylethanolamine plasmalogen; PG, phosphatidylglycerol; PI, phosphatidylinositol; PS, phosphatidylserine; SM, sphingomyelin; TAG, triacylglycerol. The mitochondria-specific CLs were most enriched by UC.
