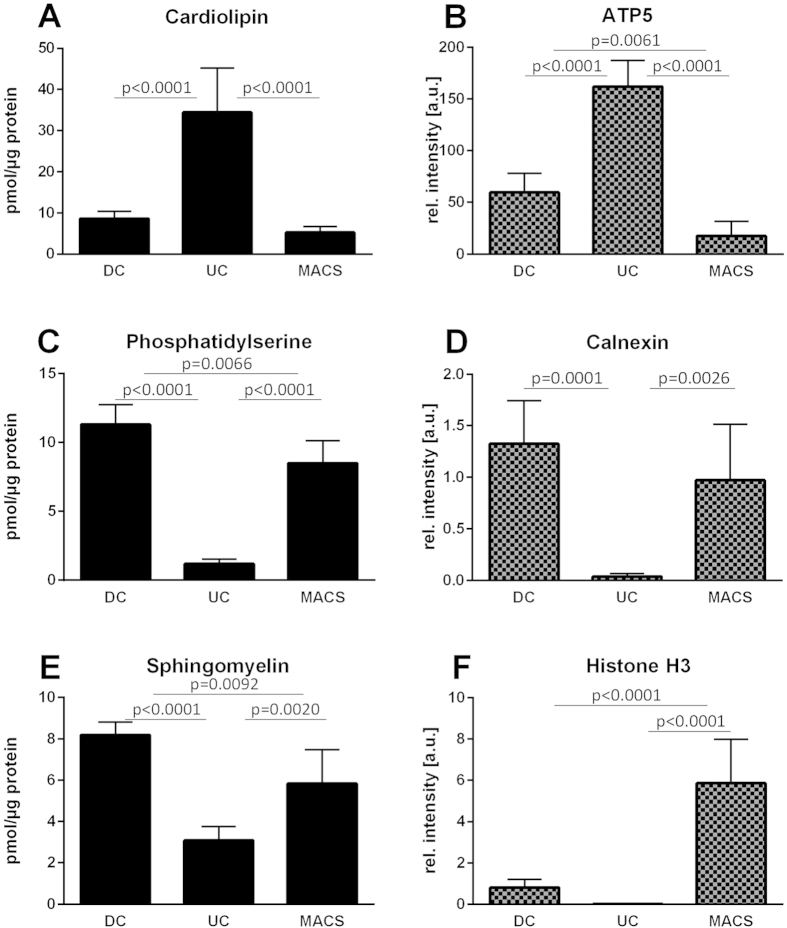
Figure 6. Comparison of lipid (left) and protein contents (right) in mitochondrial samples isolated using three different procedures, differential centrifugation (DC), ultracentrifugation (UC), and magnetic bead-assisted isolation (MACS).
Histograms show the sums of the lipid classes or the densitometric quantifications of western blots normalized to total cell lysate. Values are means ± SD of at least 5 purifications.

