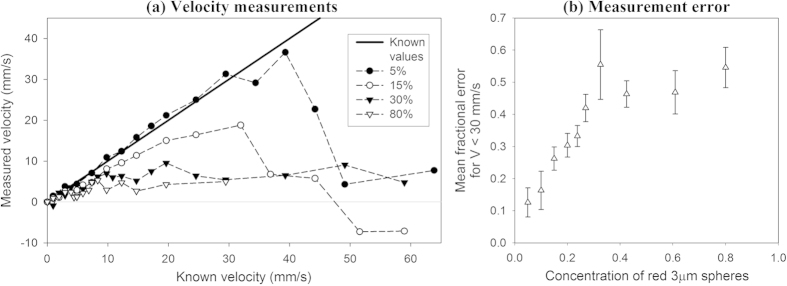
Figure 3. Comparison of the accuracy of velocity measurements made for suspensions of 3 μm red spheres in distilled water in concentrations ranging from 5% to 80% and flowing in a 600 μm tube.
The measurements were acquired with T = 0.5 ms and the 80 MHz focussed transducer. (a) shows the measurements made for concentrations of 5%, 15%, 30% and 80% with a zero offset correction applied, and with the resolution (error bars) omitted for clarity. The mean fractional error for these and intermediate concentrations are shown in (b). The mean fractional error values were calculated for velocities |V| < 30 mm/s and the error bars represent the standard errors.

