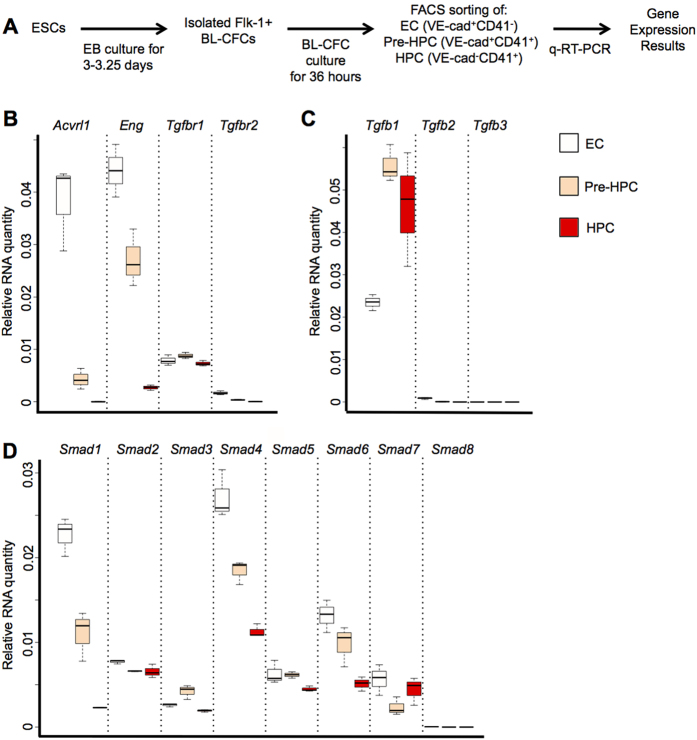
Figure 1. TGFβ pathway related genes are expressed during in vitro EHT.
(A) Experimental workflow used to generate the indicated 3 populations from ESC. (B) Expression of TGFβ receptor coding genes in EC, Pre-HPC and HPC populations. (C) Expression of TGFβ ligand coding genes in EC, Pre-HPC and HPC populations. (D) Expression of SMAD coding genes in EC, Pre-HPC and HPC populations. The box plots were generated from 3 independent experiments. For each plot, the top and bottom box edges correspond to the first and third quartiles. The black line inside the box represents the median. The top and bottom whisker lines mark the maximum and minimum values of the data set, respectively. The corresponding p-values were calculated with Student’s t-test (Supplementary Table S1).

