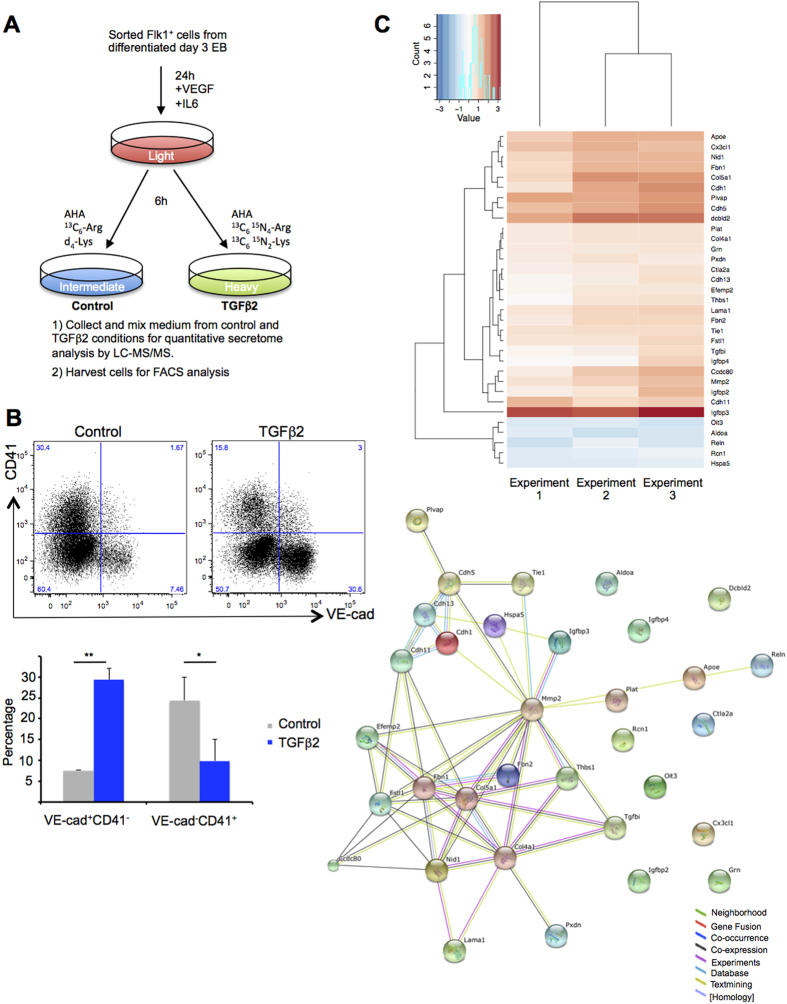
Figure 2. TGFβ treatment during BL-CFC culture favours the vascular lineage over the haematopoietic one.
(A) Experimental workflow of the quantitative secretome analysis by LC-MS/MS. (B) Flow cytometry analysis of VE-Cad and CD41 expression after 6 hours of culture following the addition of TGFβ2 compared to control condition. Upper panel shows one representative example of flow cytometry analysis while the bottom one shows a bar graph representing the average frequency of the EC (VE-Cad+CD41−) and HPC (VE-Cad−CD41+) populations from 3 independent experiments. The p-values were calculated with Student’s t-test (2 tails, type 3). EC population: **Control versus TGFβ2 p-value = 0.004 (n = 3); HPC population: *Control versus TGFβ2 p-value = 0.03 (n = 3). (C) Heatmap representing Log2 fold change (Log2 FC) of protein expression between TGFβ2 treated and non-treated samples for all the proteins detected in the 3 biological replicates. Each column represents one independent secretome experiment. (D) STRING representation of a network involving the proteins detected in C. Nine proteins out of 33 were not part of the network. Different line colours represent the types of evidence for the association between proteins.

