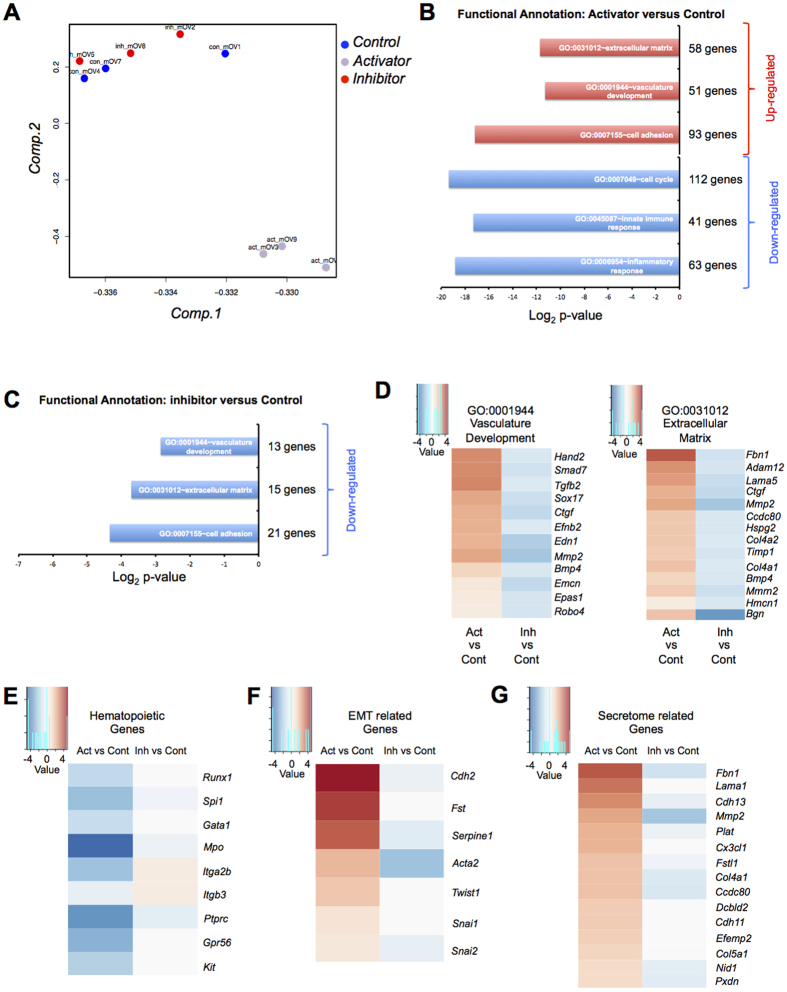
Figure 4. mRNA microarray analysis reveals the impact of TGFβ signalling activation or inhibition at the transcriptional level.
(A) Principal component analysis of the samples. (B) Functional annotation for the “Activator versus Control” contrast. The log2 p-value was plotted for each GO term. The number of genes per group is also indicated. (C) Functional annotation for the “Inhibitor versus Control” contrast. The log2 p-value was plotted for each GO term. The number of genes per group is also indicated. (D) Heatmap of Log2 FC of genes from the vasculature development (left) and extracellular matrix (right) GO terms. Log2 FC values obtained from Activator versus Control (ActvsCont) contrast were compared to the ones from Inhibitor versus Control (InhvsCont) contrast. (E) Heatmap of Log2 FC of haematopoietic genes. (F) Heatmap of Log2 FC of EMT genes. (G) Heatmap of Log2 FC of candidate genes corresponding to detected proteins in Fig. 2.

