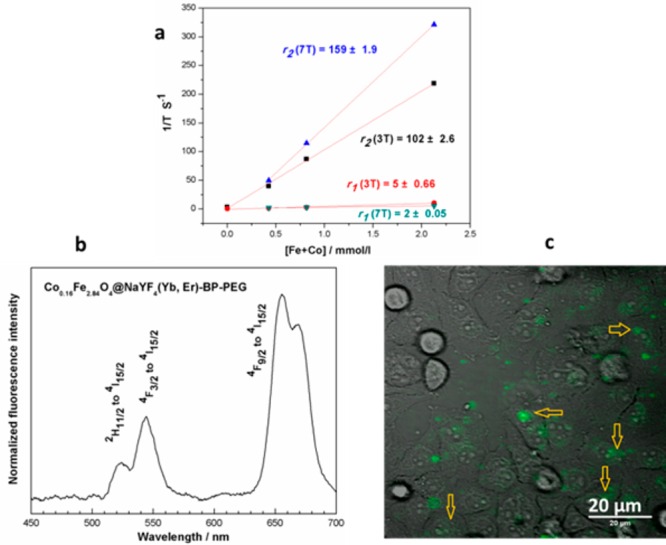
Figure 3.

(a) Curve of relaxivity against the concentration of Fe+Co for Co0.16Fe2.84O4@NaYF4(Yb, Er)-BP-PEG at 3T and 7T) (concentration of Fe and Co determined by ICP-MS); (b) up-conversion spectrum of Co0.16Fe2.84O4@NaYF4(Yb, Er)-BP-PEG under excitation by a 980 nm laser; (c) transmitted infrared image of HeLa cell culture in monolayer (gray scale) incubated with Co0.16Fe2.84O4@ NaYF4(Yb, Er)-BP-PEG and fluorescence emission image (green, 490–560 nm) overlaid. Excitation wavelength 980 nm. Arrows show green fluorescence from cell-incorporated particles.
