Figure 2.

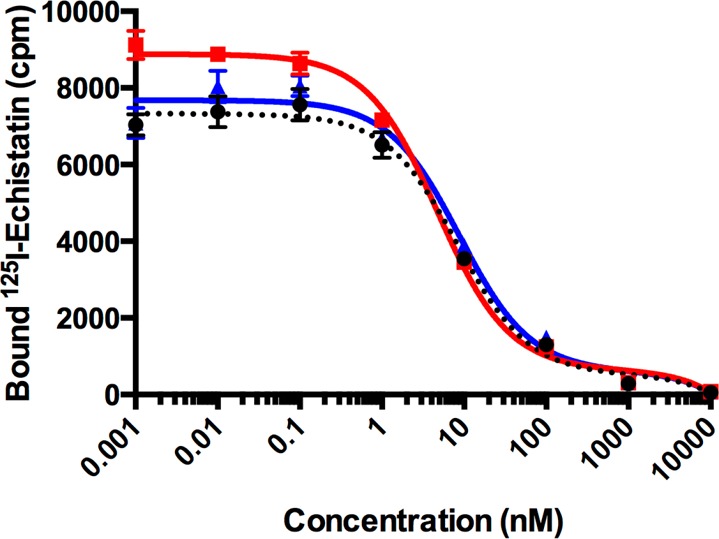
Mean concentration response curve for 125I-echistatin titrated with [Ga(THP-NCS-RGD)] (black), [Ga(THP-PhNCS-RGD)] (red), and RGD (blue) (n = 6 for each concentration; error bars correspond to standard error of the mean).

Mean concentration response curve for 125I-echistatin titrated with [Ga(THP-NCS-RGD)] (black), [Ga(THP-PhNCS-RGD)] (red), and RGD (blue) (n = 6 for each concentration; error bars correspond to standard error of the mean).