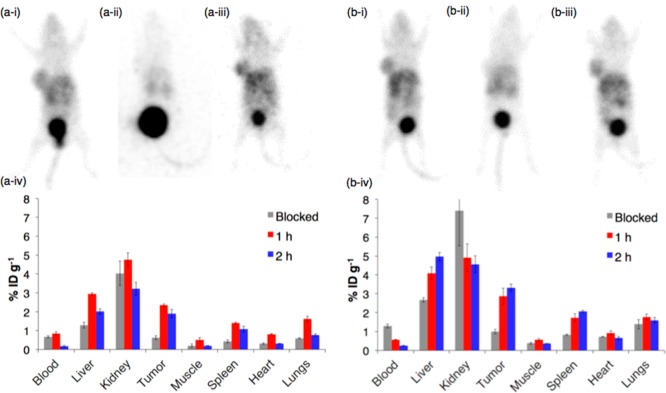
Figure 3.
PET imaging and ex vivo biodistribution of (a) [68Ga(THP-NCS-RGD)] and (b) [68Ga(THP-PhNCS-RGD)]. Representative PET maximum intensity projection of Balb/c nu/nu mice bearing a U87MG tumor on right flank at (i) 1 h PI of tracer, (ii) 1 h after coinjection of tracer and RGD, and (iii) 2 h PI of tracer, (iv) ex vivo biodistribution in mice at 1 and 2 h PI of tracer, and 1 h PI of tracer coadministered with RGD (blocked); n = 3. Error bars correspond to standard error of the mean.

