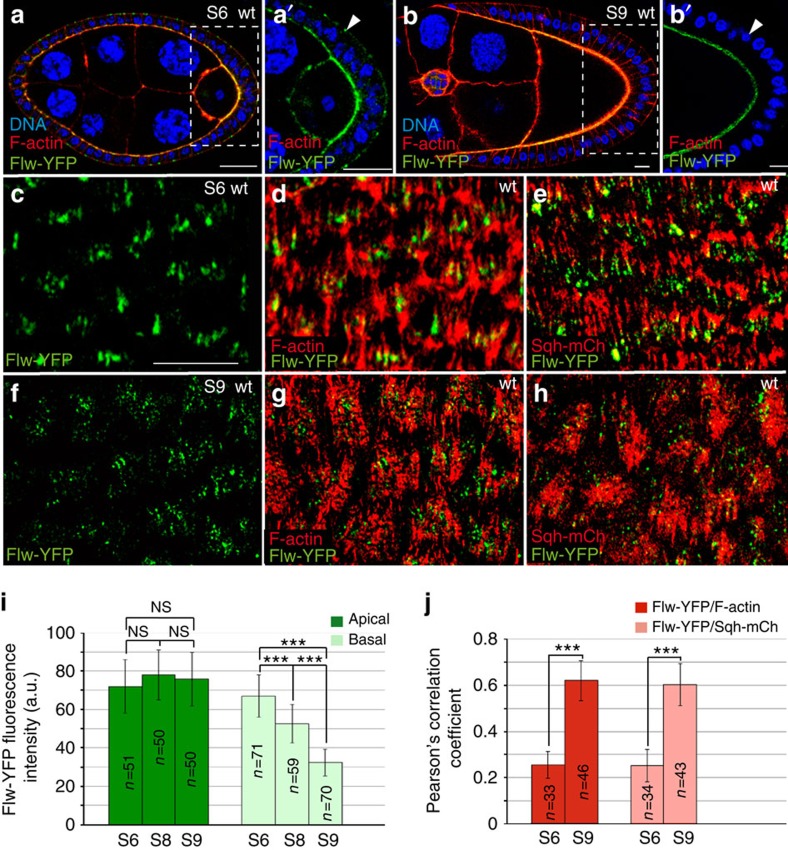
Figure 1. Control egg chamber showing the localization of Flw-YFP (green), DNA (blue) and F-actin or myosin regulatory light chain (Sqh) in red.
(a, b) Sagittal planes of S6 (a) and S9 (b) egg chambers stained with Rhodamine-Phalloidin to visualize F-actin and the nuclear marker TO-PRO-3. (a) At S6, Flw-YFP is expressed at both the apical and basal sides of FCs. (b) At S9, basal Flw-YFP localization is specifically reduced. (a′, b′) Magnifications of the white boxes in a and b, respectively. (c–h) Basal surface views of S6 (c–e) and S9 (f–h) follicles expressing Flw-YFP and either stained with Rhodamine-Phalloidin to detect F-actin (d, g) or expressing Sqh-mCherry to visualize myosin (e, h). (d) At S6, Flw-YFP largely co-localizes with F-actin, distributing asymmetrically on the filaments. (e) At S6, Flw-YFP and Sqh-mCherry show a non-overlapping distribution. (g,h) At S9, faint basal Flw-YFP puncta co-localize with actomyosin filaments. (i) Quantification of the apical and basal levels of Flw-YFP at S6, S8 and S9. (j) Pearson's coefficient correlation between Flw-YFP and F-actin and Flw-YFP and Sqh-mCh at S6 and S9. The statistical significance of differences was assessed with a t-test. NS, not significant, *** P<0.0001. All errors bars indicate s.d. Scale bar, 10 mm. Mean of n=15 egg chambers, assessed over five independent experiments.

