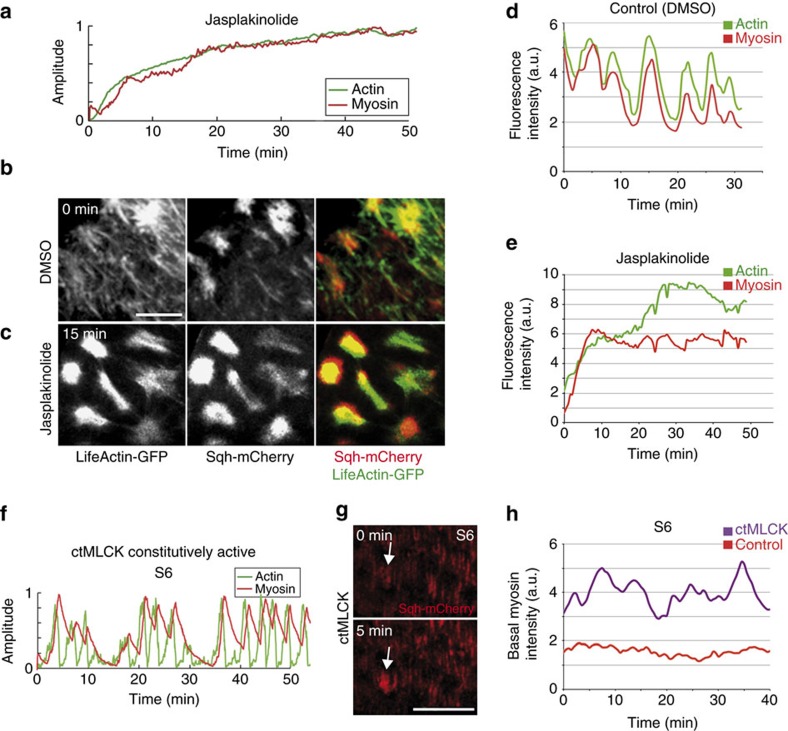
Figure 7. Basal actomyosin dynamics in jasplakinolide-treated FCs and FCs overexpressing ctMLCK.
(a) Simulation of basal actomyosin oscillations in jasplakinolide-treated FCs. (b) Life confocal image of the basal side of S10 FCs expressing Lifeact-GFP and Sqh-mCherry, 15 min after incubation with DMSO-containing culture medium. (c) Live imaging of the same egg chamber shown in (b) 15 min. after jasplakinolide addition. (d,e) Quantification of the dynamic changes of basal myosin (Sqh-mCherry, red) and F-actin (Lifeact-GFP, green) in one FC treated as above. (f) Simulation of basal actomyosin oscillations in FCs expressing ctMLCK. (g) Live confocal images of the basal side of S10 FCs expressing Sqh-mCherry and ctMLCK. The arrow points to a FC that has changed its basal level of Sqh-mCherry in 5 min. (h) Quantification of the dynamic changes of basal myosin (Sqh-mCherry) in control (red line) and ctMLCK (purple line) expressing FCs. Scale bar, 10 μm. Mean of n>32 FCs, assessed over eight independent experiments.

