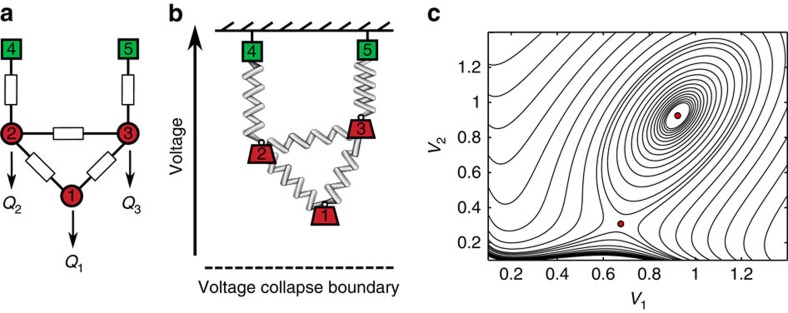
Figure 1. Mechanical and energy interpretations of power flow.
(a) An example power network with two generators (green) supplying power to three loads (red). Power demands (Q1, Q2, Q3) are placed on the load nodes; (b) a mechanical analogy: a linear spring network placed in a potential field. The generator voltages (green) are ‘pinned' at constant values, while the load voltages (red) are masses ‘hanging' off the generators, their equilibrium values being determined by their weights (the power demands QL=(Q1, Q2, Q3)), the heights of the fixed-generator voltages (V4, V5), and by the stiffness of the spring network (the susceptance matrix B). Voltage collapse can occur when one of the masses crosses an appropriate collapse boundary curve; (c) Contour plot of energy function when Q3=0 and node 3 is eliminated via Kron reduction13. Since E(VL) contains logarithms, it tends to −∞ as either axis is approached. In a normalized system of units, the stable high-voltage equilibrium rests in a local minimum at (0.94, 0.94), while an unstable low-voltage equilibrium sits at the saddle (0.68, 0.30). Voltage collapse occurs when these equilibria coalesce and the system trajectory diverges.

