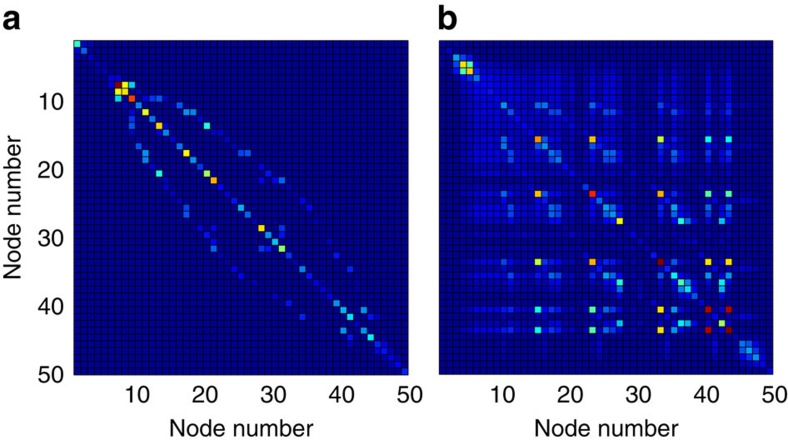
Figure 2. Sparsity patterns of network matrices for 57 node test case.
(a) the stiffness matrix Qcrit representing the auxiliary network. (b) The inverse stiffness matrix  . The 57 node network contains 50 loads and 7 generators. Nodes are sorted and grouped by connected components of the subgraph induced by Qcrit, with connected components ordered from largest to smallest; nodes {1,…,48} are part of one large connected component, while nodes {49, 50} each constitute their own component. Colour scale represents normalized values of the matrix elements, with dark blue being zero and red being one. Diagonal elements of Qcrit are displayed in absolute value for clarity.

