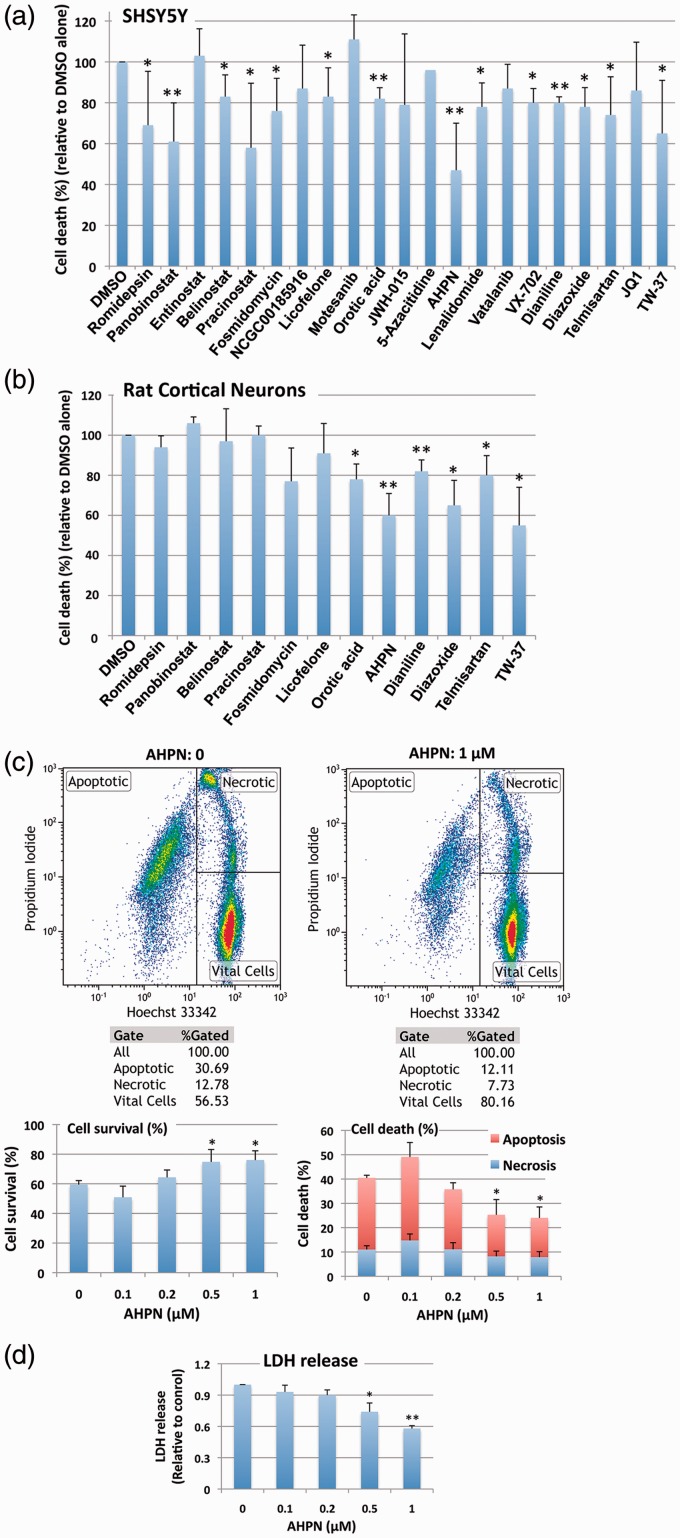
Figure 5.
The effect of small molecules identified by qHTS on OGD/ROG-induced cell death in SHSY5Y cells and E18 rat cortical neurons. After OGD/ROG exposure (OGD/ROG: 16 h/5 h for SHSY5Y, 5 h/16 h for cortical neurons) in the presence or absence of the small molecules indicated, cell death/survival was assessed via nuclear staining with Hoechst 33342 and propidium iodide (PI) followed by FACS analyses. The percentage of total cell death (both apoptotic and necrotic) was calculated and recorded vs the percentage of 0.1% DMSO control cell death in each experiment. (a) SHSY5Y cells. (b) Rat cortical neurons. (c) Increasing concentrations of AHPN displayed statistically significant increases in viability and decreases in cell death after OGD/ROG as measured by FACS analysis. Upper panels: representative dot plots without AHPN (left) and with 1 µM AHPN (right) with numbers in each population (left, apoptotic cells; upper right, necrotic cells; lower right, viable cells); lower panels: Quantitative analyses of cell survival (left) and cell death (right). (d) Increasing concentrations of AHPN displayed statistically significant decreases in cell death as measured by LDH release. Data represent the means ± standard deviation of three independent experiments. **p < 0.01, *p < 0.05 compared with OGD/ROG without AHPN by student's t-test.

