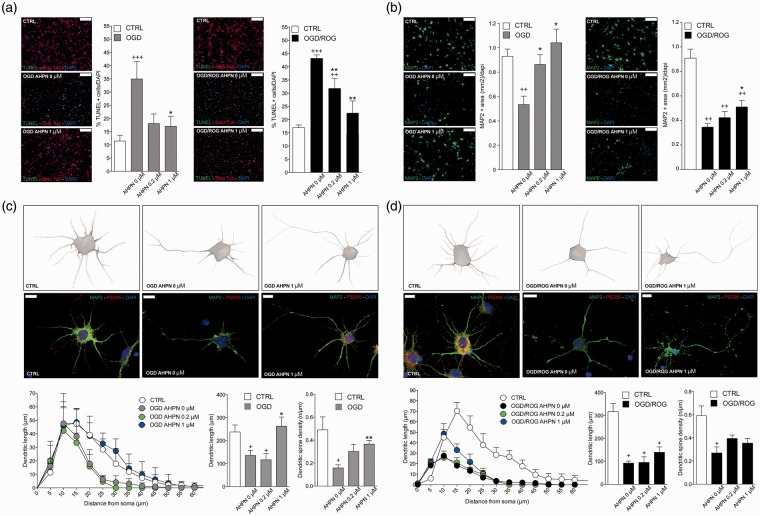
Figure 6.
AHPN reduces ischemic neuronal apoptosis and preserves dendritic/synaptic integrity in vitro. (a) Representative images of TUNEL+ (in green) and β-tubulin+ (in red) neurons and quantitative analysis. Nuclei are counterstained with DAPI (blue). Scale bars: 100 µm. Data are means ± standard error. *p ≤ 0.05, compared with OGD and OGD/ROG controls, respectively. +++p ≤ 0.001, ++p ≤ 0.01, compared with non-hypoxic CTRL neurons; **p ≤ 0.01, *p ≤ 0.05, compared with OGD or OGD/ROG controls. (b) Representative microphotographs of primary cortical neurons dendrites stained for MAP2 (green) and corresponding quantification. Nuclei are counterstained with DAPI (blue). Scale bars: 100 µm. Note the dose-dependent increase of MAP2 expression induced by AHPN in both OGD and OGD/ROG treated neurons. ++p ≤ 0.01 compared with non-hypoxic CTRL neurons; *p ≤ 0.05, compared with OGD or OGD/ROG controls. (c,d) Representative reconstructions and microphotographs of OGD (c) and OGD/ROG (d) primary cortical neurons treated with AHPN. Dendrites are stained with MAP2 (green), while spines are stained with PSD95 (red). Nuclei are counterstained with DAPI (blue). Scale bars: 10 µm. Sholl analysis of dendritic length with nested concentric spheres centred at the cell soma and with a gradually increasing radius (5 µm) showing cumulative dendritic length in the function of cell soma distance, the integrated total dendritic length, and the spine density of primary cortical neurons. +p ≤ 0.05, compared with non-hypoxic CTRL neurons, **p ≤ 0.01, *p ≤ 0.05, compared with OGD or OGD/ROG controls.

