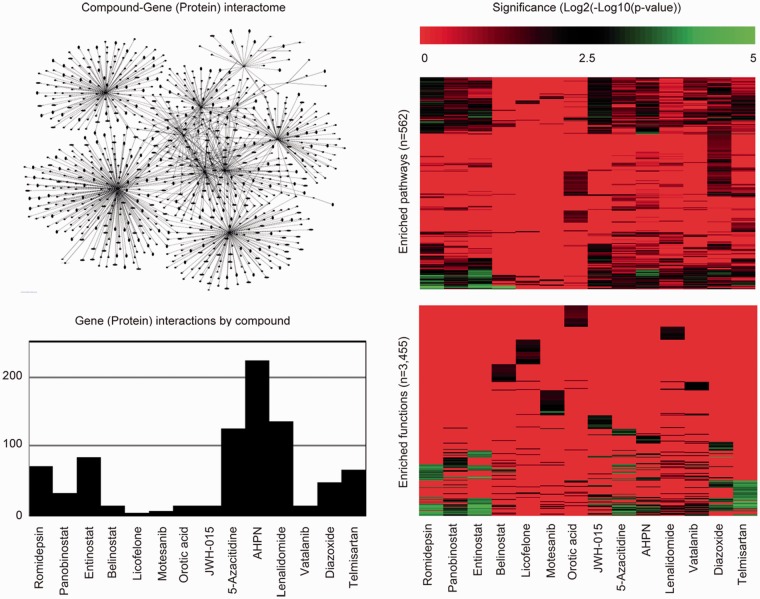
Figure 7.
Off-target enquiry. The Ingenuity Pathway Analysis tool (IPA) was used to query all gene (protein) interactions by compound (www.ingenuity.com). These interactions were summarized in two ways. First, a network was constructed across compounds to demonstrate that no exclusive gene (protein) interactions exist (upper left plot). Second, a bar plot was constructed to describe that the number of gene (protein) interactions by compound is unbalanced (lower left plot). To gauge and compare compound impact on biological pathways and functions, IPA was used to report enrichment p-values (Fisher’s exact test) for 562 pathways (upper right plot) and 3455 functions (lower right plot).

