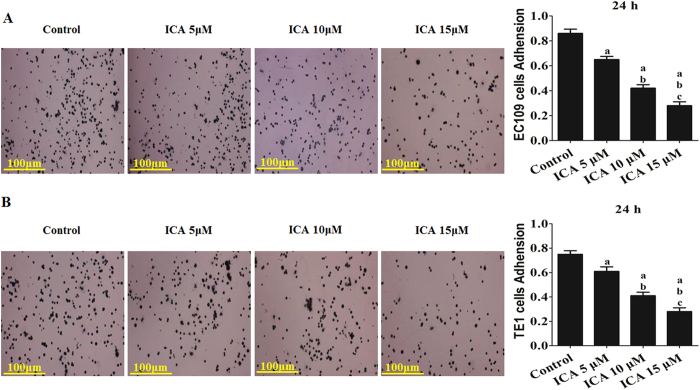
Figure 3. Effect of ICA treatment on the adhesion of human ESCC cells (24 h).
(A) The adhesion ability of EC109 cells is expressed as an adhesion ratio. (B) The adhesion ability of TE1 cells is expressed as an adhesion ratio. The number of adherent cells in the control group was set as 100%. The results are expressed as the mean ± SD; n = 6. aP < 0.05 vs. the control group; bP < 0.05 vs. the 5 μM ICA-treated group; cP < 0.05 vs. the 10 μM ICA-treated group.

