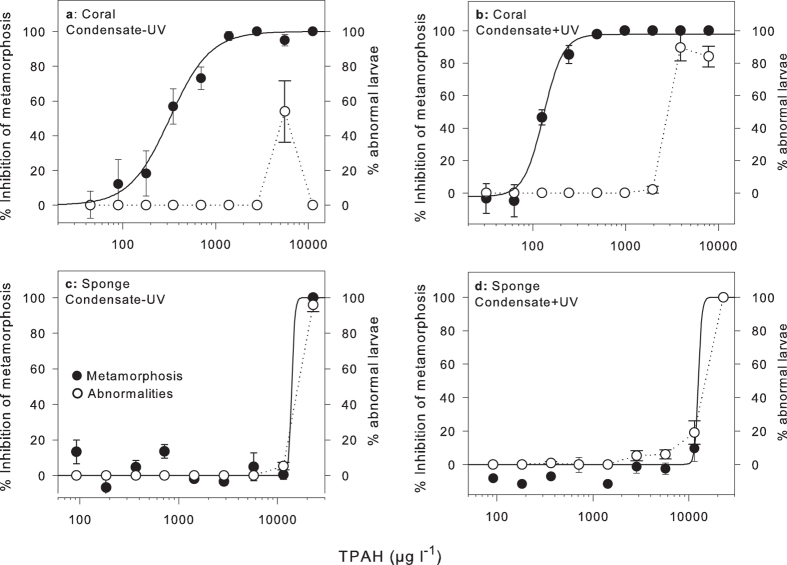
Figure 2. Concentration-response curves for inhibition of metamorphosis of coral and sponge larvae in the presence of condensate WAF (μg l−1 TPAH).
Closed circles represent mean inhibition (%, relative to control) of coral larval metamorphosis to condensate WAF in the (a) absence of UV and (b) presence of UV and of sponge larval metamorphosis to condensate WAF in the (c) absence of UV and (d) presence of UV. Open circles represent mean abnormalities (%) of larvae in the same treatments. Mean ± SE of six replicate exposures. Summary results from these curves can be found in Table 3.

