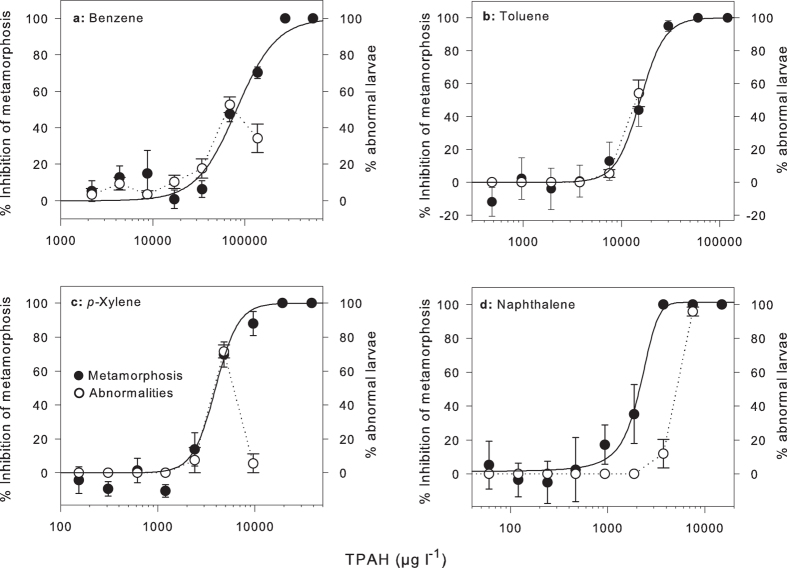
Figure 3. Concentration-response curves for inhibition of metamorphosis of coral larvae in the presence of the major aromatic components found in condensate WAF (μg l−1).
Closed circles represent mean inhibition (%, relative to control) of coral larval metamorphosis to (a) benzene, (b) toluene, (c) p-xylene and (d) naphthalene. Open circles represent mean abnormalities (%) of larvae in the same treatments. Mean ± SE of six replicate exposures. Summary results from these curves can be found in Table 3.

