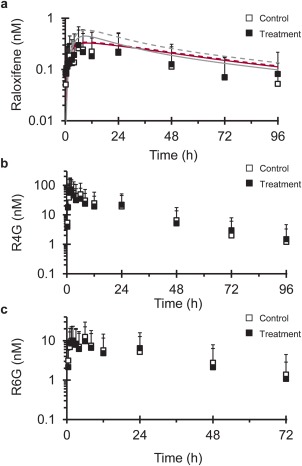
Figure 2.

Geometric mean concentration–time profile of (a) raloxifene, (b) raloxifene‐4′‐glucuronide (R4G), and (c) raloxifene‐6‐glucuronide (R6G) following a single 60 mg oral dose of raloxifene given alone (open symbols) or after silibinin (480 mg three times daily × 4 days) treatment (solid symbols). Lines in (a) denote PBPK model simulations of raloxifene concentration–time profiles when given alone (solid line) or with silibinin (dashed line) using Berkeley Madonna (gray) or SimCYP (crimson). R6G concentrations are not reported beyond 72 hours due to concentrations being below the lower limit of quantitation (c). Symbols and error bars denote observed geometric means and upper limits of the 90% confidence interval, respectively.
