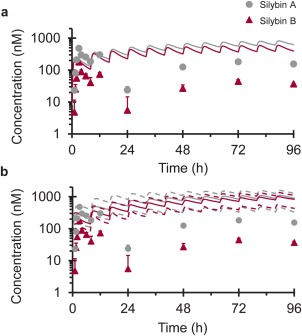
Figure 4.

Geometric mean concentration–time profiles of silybin A (gray circles) and silybin B (crimson triangles) following oral administration of silibinin (480 mg three times daily × 4 days). Solid lines denote PBPK model simulations of mean concentration–time profiles using Berkeley Madonna (a) or SimCYP (b). Dashed lines denote upper and lower 90% confidence intervals (b). Symbols and error bars denote observed geometric means and upper limits of the 90% confidence interval, respectively.
