
Figure 5.
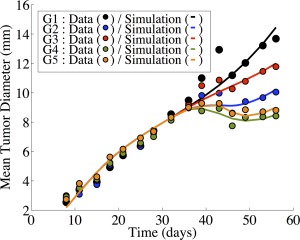
Numerical simulation of Experiment 2 (Supplementary Table S2). Simulations are the result of the interaction model. The five arms to this experiment are as follows: control (black), sunitinib monotherapy (blue), irinotecan monotherapy (red), and two combination protocols. Group 4 (green) involves sunitinib being given once daily for 12 days, with a single dose of irinotecan at day 2. Group 5 (orange) involves sunitinib being given once daily for 12 days, with a single dose of irinotecan at day 15.