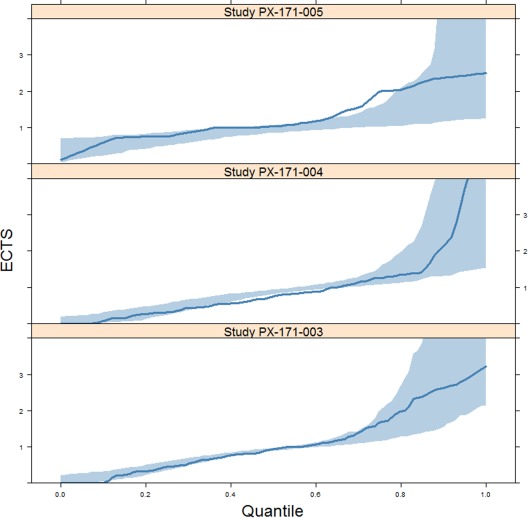
Figure 2.

Posterior predictive check of the final tumor growth inhibition model in studies PX‐171‐003, PX‐171‐004, and PX‐171‐005. Blue lines and shading represent the observed distribution and 95% prediction intervals, respectively. ECTS, early change in tumor size.
