
Figure 4.
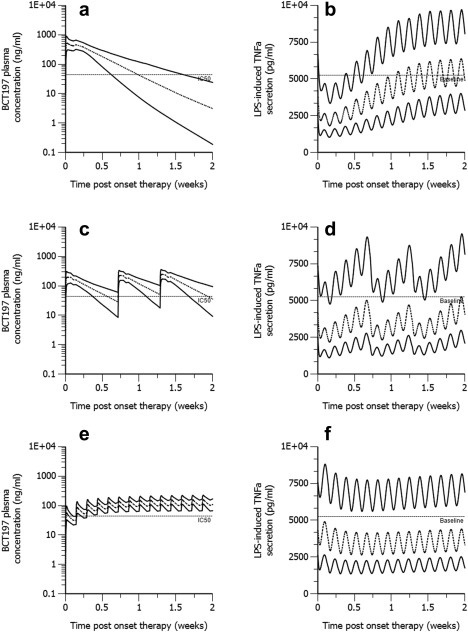
Stochastic simulation of pharmacokinetics and corresponding drug effect in naïve healthy volunteer subjects (n = 500) treated with oral BCT197 given as (a,b) 75 mg single dose, (c,d) 25 mg on days 1, 6, and 10, and (e,f) 5.36 mg once daily for 14 days. All simulations used the PK‐PD model parameters of Table 1. The lower and upper solid lines represent the 5th and 95th percentile of simulated data. The dashed line is the 50th percentile. Horizontal reference lines in the PK and PD indicate the estimated population IC50 and predose PD baseline, respectively.