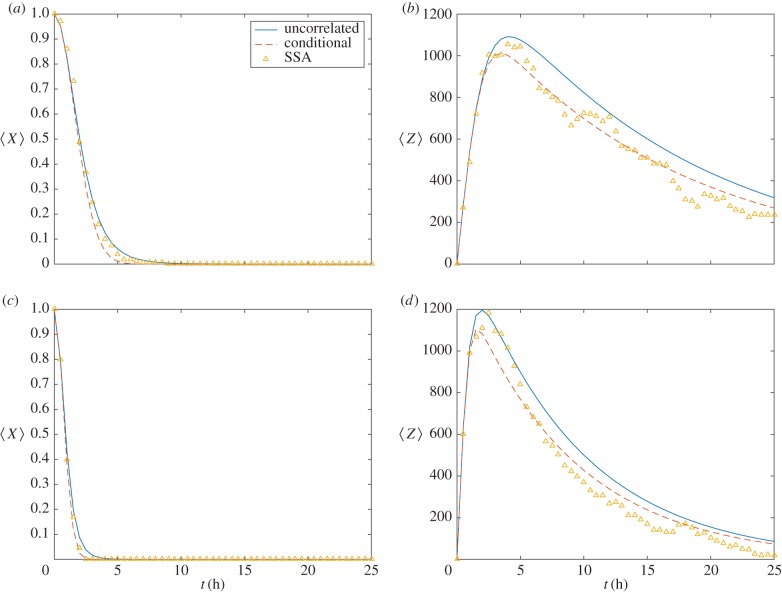
Figure 3.
Investigating the moment closure approximation used to derive equations (2.5). (a,c) Expected number of DSBs,  is plotted against time, t. (b,d) Expected number of γH2AX molecules,
  , is plotted against time, t. Realizations of equation (2.1) are averaged (markers) and compared with solutions of equations (2.8) (dashed lines) and (2.5) (solid lines). Parameter values defined in table 1. MDA-MB-468 (a,b); MCF7 (c,d). (Online version in colour.)

