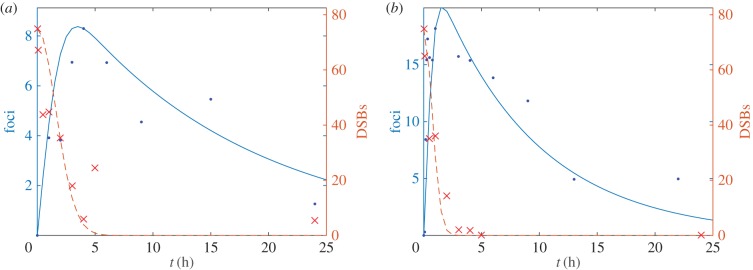
Figure 4.
γH2AX foci (solid lines, dots) and DSB (dashed lines, crosses) number are plotted against time for (a) MDA-MB-468 and (b) MCF7 cells. Experimental data are denoted by markers. The solution of the averaged model (2.8) (lines) was computed using the optimized parameter sets presented in table 1. (Online version in colour.)

