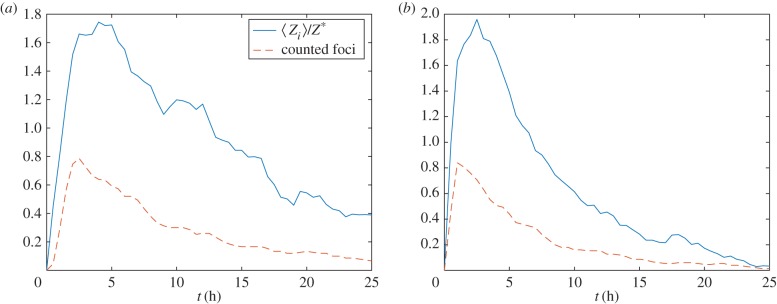
Figure 5.
The average number of detectable γH2AX foci ( , solid line) and γH2AX molecules (〈Z〉(t), dashed line) are plotted against time. (a) MDA-MB-468 and (b) and MCF7. Realizations of equation (2.1) were calculated using Gillespie's algorithm. Parameter values as in table 1. (Online version in colour.)

