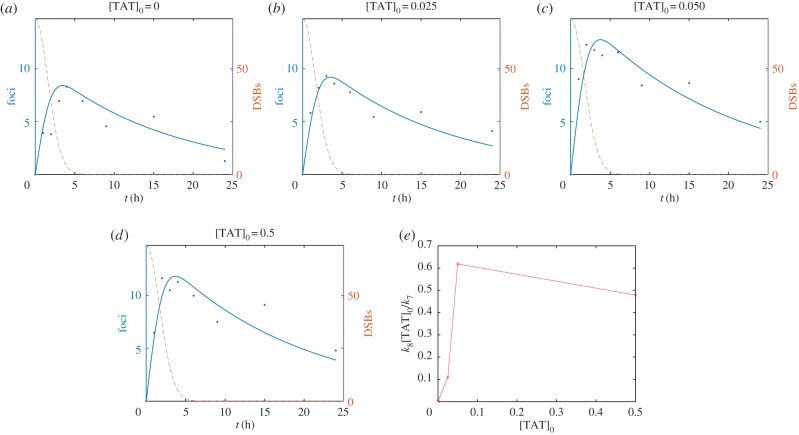
Figure 7.
γH2AX foci (solid lines, dots) and DSB (dashed lines) number are plotted against time. (a) [TAT]0 = 0, (b) [TAT]0 = 0.025, (c) [TAT]0 = 0.05 and (d) [TAT]0 = 0.5 µg ml−1. Lines represent solution to equations (4.1). Markers represent experimental observations from MDA-MB-468 cell line. (e) Fitted value of the parameter grouping k8[TAT]0/k7 is plotted against [TAT]0. (Online version in colour.)

