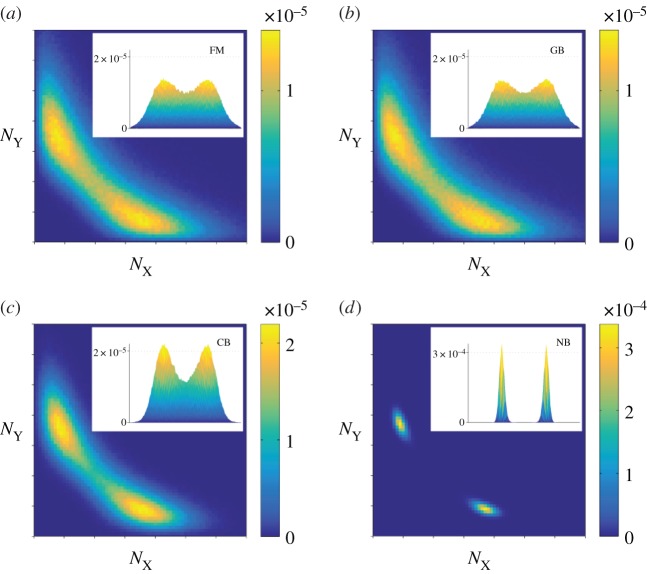
Figure 2.
Stationary distribution of protein numbers, shown in the range  on a linear scale on both axes. (a) FM: full model describing the mRNA and protein populations; (b) GB: protein-only model with geometrically distributed bursts; (c) CB: protein-only model with constant bursts; and (d) NB: protein-only model without bursts. (Online version in colour.)

