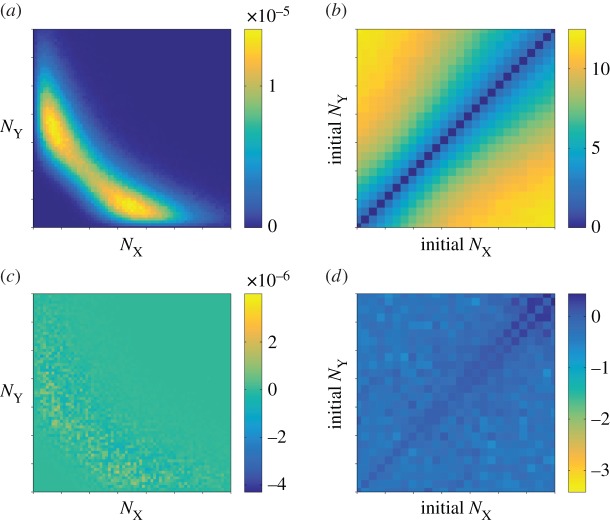
Figure 5.
PDMP approximation. (a) Stationary distribution. (b) MFST in the unit of cell cycles as a function of initial protein numbers. (c) Net deviation of the stationary distribution from the full model. (d) Net deviation of the MFST of the PDMP model from the FM. All axes are on linear scales and show the range  (Online version in colour.)

