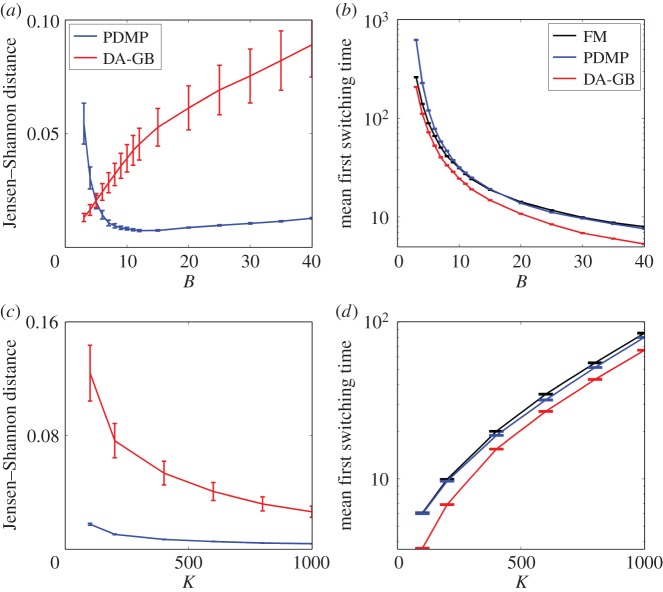
Figure 6.
Performance of the PDMP model and the diffusion approximation of the GB model (DA-GB). (a) Jensen–Shanon distance between the stationary distribution PDMP (and DA-GB) and the stationary distribution of the FM. (b) MFST for varying value of B at fixed K = 200. (c,d) Similar to (a,b) but now varying K at fixed B = 30. (Online version in colour.)

