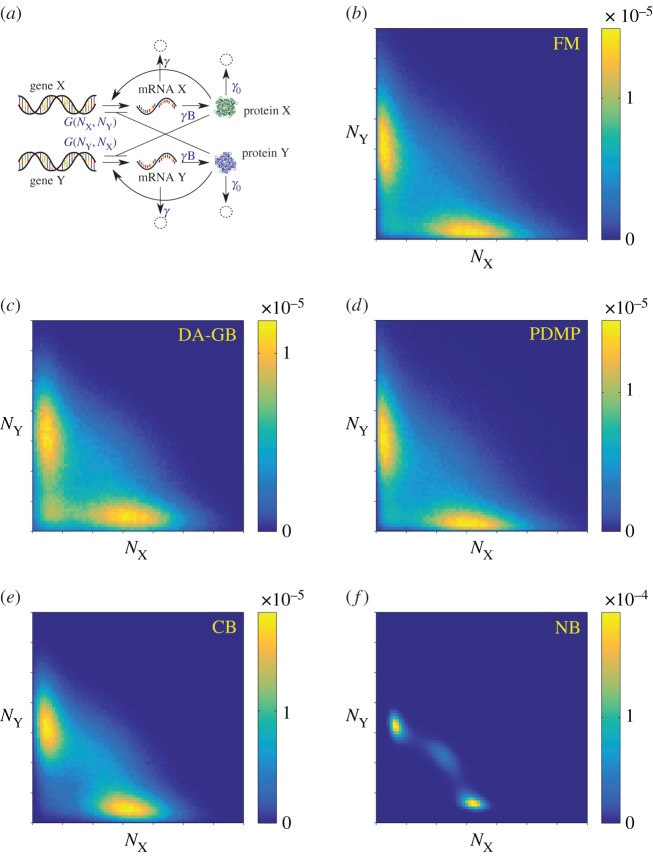
Figure 9.
(a) Schematic diagram illustrating the network of the three-way switch, remaining panels show stationary distribution of protein numbers in the range  on linear scale. (b) Full model; (c) diffusion approximation of the GB model; (d) PDMP approximation; (e) CB model; and (f) NB model. (Online version in colour.)

