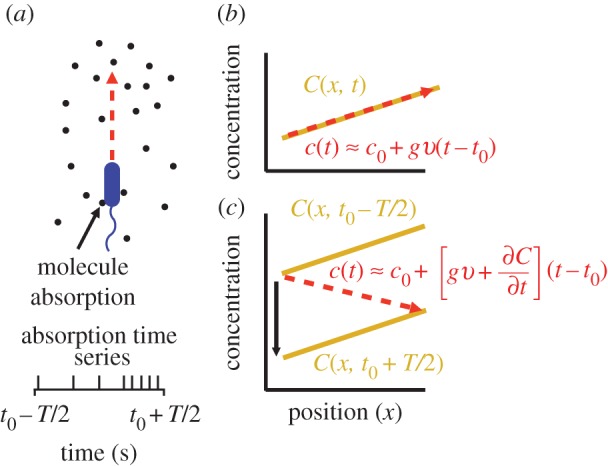
Figure 1.

Measurement of ramp rate c1 by an idealized cell. (a) During a time interval of length T, a cell travels from a region of low concentration to a region of higher concentration, absorbing chemoattractant molecules at times {ti} (spikes in absorption time series). (b) In a static concentration field C(x), c1 is equal to concentration slope g (slope of solid orange line) multiplied by swimming speed v. (c) In a dynamic concentration field C(x, t),  g is confounded with temporal changes in concentration (
 ) and the cell may perceive a decreasing concentration (red dashed line) although the true concentration slope is positive. (Online version in colour.)
