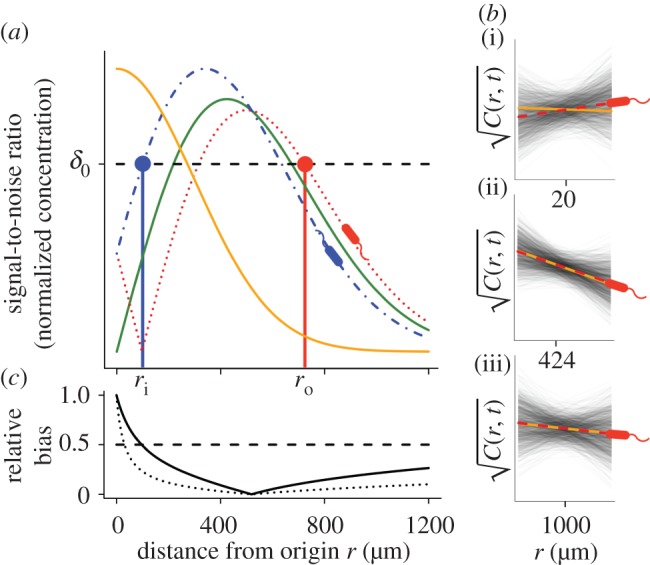
Figure 2.

Gradient estimation in a dynamic environment. (a) Solid orange curve shows the true concentration profile at t = t0. Solid green unimodal curve shows the SNR of  a cell would experience if this concentration profile were static. Dotted red curve shows the SNR for a cell swimming directly towards the origin of the pulse. Dash-dot blue curve shows the SNR for a cell swimming directly away from the origin of the pulse. Concentration and SNR normalized to a maximum value of one. (b) Square root of concentration
 at t = t0 (solid orange line) and individual estimates of this concentration
  semi-transparent grey; mean of estimates shown by dashed red line) made by a cell swimming towards the pulse origin. Each individual estimate is computed by calculating
  and
and  (see the electronic supplementary material for equations) from a time series of random Poisson molecule arrivals [30] with an arrival rate given by the true instantaneous concentration at the bacterium's position C(x, t). (c) Relative bias of concentration slope estimate
  measured by slow (solid curve; v = 30 µm s−1) and fast swimming cells (dotted curve; v = 96 µm s−1). In all panels, the concentration is governed by equation (2.3) with N = 3, M = 1011 molecules, v = 30 µm s−1, a = 1 µm, T = 0.1 s, t0 = 45 s and δ0 = 1. Pulse sizes in all figures correspond roughly to the quantity of free amino acids released from a lysed phytoplankton cell of approximately 10 µm in diameter [5]. (Online version in colour.)
