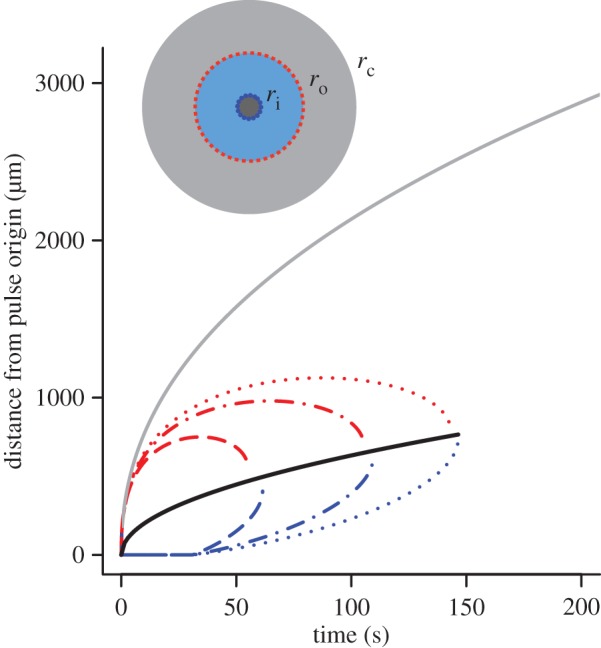
Figure 3.

Inner (blue) and outer (red) boundaries of the region in which cells reliably perceive gradients. Dashed line shows v = 30 µm s−1, maximum swimming speeds of E. coli [10]; dashed-dotted line shows v = 66 µm s−1, typical cruising speed of Vibrio coralliilyticus; dotted line shows v = 96 µm s−1, maximum speed of V. coralliilyticus after initiating chemokinesis [17]. Other parameters as in figure 2. Solid grey curve is the outer boundary, rc, of the region within which cells can resolve absolute concentration. Solid black curve is  the radius at which the SNR is maximized for a static profile (green curve in figure 2). Inset shows relative sizes of the region where cells can detect gradients (ri < r < ro, blue region), and the region where cells can resolve absolute concentration (r < rc, grey region inward) at t = 90 s (v = 66 µm s−1). (Online version in colour.)
