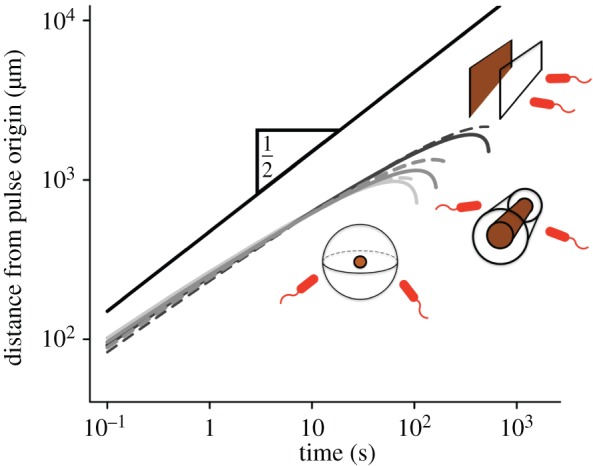
Figure 4.

Scaling of the outer boundary of sensitivity ro for pulses emitted from surfaces (light grey), filaments (grey) and point sources (black). Solid curves are numerical solutions to equation (3.1). Dashed curves are given by equation (3.2). The solid black line is proportional to  . Solid curves are truncated when the SNR falls below δ0. Dashed curves are truncated at t* (equation (3.3)). M is scaled so that pulses with different geometries have the same concentration profile at t = 10 s (M = 8.0 × 10⁵ molecules per µm2 surface for surface source; M = 2.8 × 10⁸ molecules per µm length for line source; M = 1011 molecules for point source); v = 66 µm s−1; other parameters as in figure 2. (Online version in colour.)
