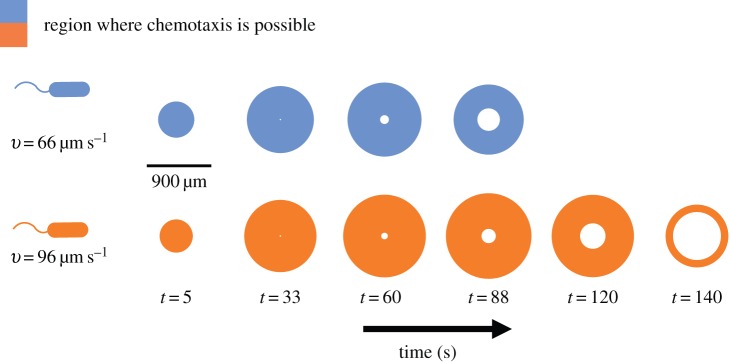
Figure 5.
Effect of swimming speed on the time evolution of the region where chemotaxis is possible. Coloured regions show a two-dimensional cross-section of the region in which cells can resolve chemoattractant gradients (i.e. conditions (2.2) are satisfied). Blue regions are those experienced by a cell travelling at a cruising speed typical of the bacterium V. coralliilyticus (approx. 66 mms−1). Orange regions are those experienced by a V. coralliilyticus cell travelling at a high speed after initiating chemokinesis (approx. 96 µm s−1) [17]. Other parameters as in figure 2. Note the blind spot that forms at the centre of the region as the inner boundary of sensitivity, ri, expands. (Online version in colour.)

